Continuous mercury monitoring benefits cement plants – part 2
Published by Katherine Guenioui,
Editor
World Cement,
Field test at Finnish Cement Plant
The CMM was installed on the emission stack of a rotary kiln cement plant with an electrostatic precipitator (ESP) for particulate emission control (Figure 2). The test period lasted 30 days. The fuels used during the test included coal, petroleum coke and recovered fuels. The flue gas composition at the measurement point is summarised in Table 1.

Figure 2.
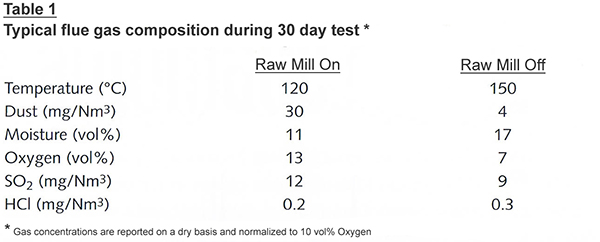
Table 1.
During the field trial, the raw mill was periodically stopped and the variation in mercury levels was monitored together with changes in other process parameters. Average mercury concentration when the raw mill was running was 6 to 8 µg/Nm3 and when the raw mill was stopped, the concentrations could increase to 20 – 40 µg/Nm3. The plant had an emission limit value of 50 µg/Nm3 for total mercury.
Figure 3 shows a typical 24-hour period of emissions including raw mill on and raw mill off conditions. In addition to Hg0 concentration, the dust loading and raw mill state are shown because these are the main parameters expected to have an impact on the mercury analyser.
Results
The main goal of the test was to ensure the stability and repeatability of mercury measurement in demanding process conditions and to determine whether cement dust causes analyte loss and increased response time in the sample extraction probe.
The only process variable that clearly correlates with mercury concentration is the raw mill on/off state. When the raw mill is on, the variation in dust loading or other gas concentrations (O2, H2O, acid gases such as SO2 and HCl) does not correlate with variation observed in mercury concentration. When the raw mill is switched off, all gases including mercury undergo a change in concentration, but this is clearly brought about by the raw mill state.
In order to estimate the repeatability of the Hg measurement at zero and span levels, the CMM analyser was configured to perform zero tests with synthetic nitrogen and span tests with Hg0 test gas generated by the mercury calibrator in the CMM system at 4-hour intervals. The normal test interval required by the analyser is 24 hours, but in the interest of creating more test data, the interval was shortened in this test. All test gases are injected into the probe upstream of particle filters so that the test gas has to pass through the potentially contaminated filters.

Figure 3.

Figure 4.
The results from six repeated span/zero test cycles are shown in Figure 4. The target level for the span check was 6.5 µg/Nm3 and the average span level was 6.60±0.036 µg/Nm3. The average result for the zero check was -0.006 ± 0.036964 µg/Nm3. If the dust accumulating in the sample extraction probe were to cause analyte loss during span tests, the later tests would show a decrease from the span check target value, but this was not observed. If the dust in the probe were to make the response time longer (memory effect), the later tests would show a slower response than the first tests. Again, there was no systematic change in the test results and the tests 1 – 6 exhibited very consistent results.
The span and zero checks also provided an opportunity to characterise the response time of the analyser when the span test at a known concentration is followed by a zero check with a zero concentration. The data from all six tests in Figure 3 were combined together into one dataset in Figure 4 by synchronising the moment when the span/zero check cycle was started. A Boltzmann sigmoidal curve (eqn 1) was fitted to the experimental data using GRG nonlinear fitting routine in the Microsoft Excel Solver package. The parameters of the response curve are summarised in Table 2.

Equation 1.

Table 2.
The response time was evaluated as T90-10, the time interval between a reading representing 90% of the span check value and a reading representing 10% of the span check value. The response time from this calculation was 10.15 minutes or just over two measurement cycles (measurement data is obtained as 5 minute rolling averages of the mercury concentration). The live data from the emissions shows peaks of comparable sharpness, but these were not subjected to the same analysis as the span/zero check data.
Summary
The requirements of a continuous mercury monitoring system in a cement plant are as follows:
Since the main application areas for continuous mercury monitoring systems have been in hazardous and municipal waste incineration, and coal fired power stations with conditions that are different to cement plants, care must be taken to ensure that the monitoring system, and especially its sample extraction probe, is suitable for the process conditions. This study demonstrates that a CVAF spectrometer and dilution sampling approach can be successfully used in this application.
Written by Antti Heikkilä, Gasmet Technologies and edited by Katherine Guenioui
Read the article online at: https://www.worldcement.com/the-americas/16052014/continuous_mercury_monitoring_benefits_cement_plants_210-/
You might also like
The World Cement Podcast
A podcast series for professionals in the cement industry featuring short, insightful interviews. Subscribe on your favourite podcast app to start listening today.
![]()
![]()
![]()
![]()

