A revolution in the profitability of Indian cement plants
India can be a chaotic place, and this is also true of the cement industry. In all, there are 160 plants spaced at an average distance of 150 km apart. On average, you will find eight competitors within a 300 km radius. Other challenges include intensive overlapping of markets, areas of both under and over supply, and hundreds of depots and batch plants competing with each other. Many plants have too much business and others do not have enough.
The methods used for ‘costing’, pricing and marketing in the cement industry are often poor and old-fashioned. Inadequate costing methods bring the wrong result: often they bring in a mix of work to the company that will not maximise profit. Some cements that could be made, but are not currently being made, are significantly more profitable than others. Mobile batching plants can add vast profits to the mother plant. In my opinion, the costing function, methods and procedures are looking at the wrong information and data. Likewise, the logic of Indian cement plant costing, pricing and competitive marketing is looking in the wrong direction. Costing should look at the bottlenecks. Ordinarily, the best way to make a cement plant profitable is to maximise the added value per kiln hour.

| Find bottlenecks and maximise profits. |
To maximise profits, all products and all customers should be ranked in total added value per kiln hour so that the plant can work to increase those at the top of the list and get rid of those at the bottom. Generally speaking, the best customer offers 10 to 20 times more added value per kiln hour than the worst, but many costing departments will argue that they offer similar profitability. Although it is the same clinker in the kiln, value is then added all the way to the customer. One of my golden rules is to never separate production costs from distribution costs. Many plants do this and it leads to a misleading price calculation. Instead, one should always look at the total added value per kiln hour including delivery to the final customer.

| I have used the Boston Matrix to illustrate that this company has a large number of very profitable customers, large and small. |
What does this mean?
If you look at added value per delivered tonne per kiln hour you can double the economic delivery distance by road. The best high throughput customers are so profitable you can easily afford to deliver 500 km away instead of 250 km. Increasing your delivery distance from a radius of 250 km to 500 km expands your target market four-fold (on the basis that the area of a circle is Πr2). The business area increases in this example from 200 000 km2 to approximately 800 000 km2. As an average, for the whole of India, the population of your economic market will increase from 70 million to 280 million people. The best customers still make you more profit than others because many types of cement have very high added value per kiln hour. This is increased after the kiln by specialist additives, special milling, batch plants, etc. but the time the cement is in the kiln is the same. Look at it this way: each customer is renting the kiln. With this approach it is much easier to fill the cement plant with very profitable orders and customers.
A recent example of changing the product mix to gain much higher economic travel distances was comparing PPC cement to OPC. In this project, if the company manufactured PPC instead of OPC, the kiln would generate an extra Rp.830 000 of added value every hour. This would allow the PPC to be transported an extra 1800 km by road. In other words, this PPC manufacturer could afford to despatch cement to anywhere in India and still make more profit than if making OPC. Also it is much easier to fill the plant, because their market is the whole country, and they have a 0.1% market share.
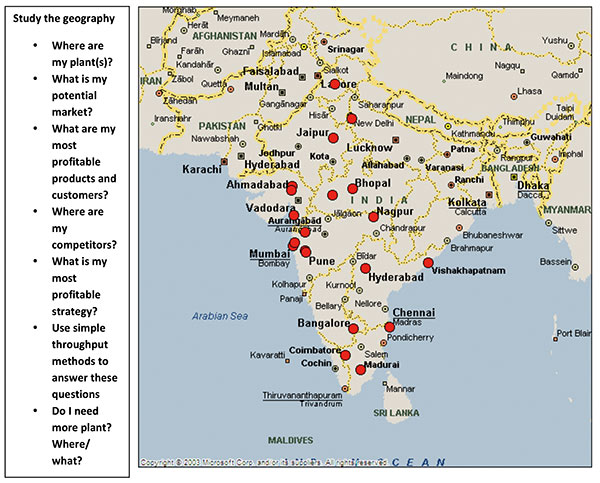
| Map of India. |
Summary
- Change the way you look at profitability. Look at the opportunities to increase added value at no extra cost in terms of production and distribution.
- Find the bottlenecks.
- Find the best mix of products and customers for your plant.
- Increase your customer range from 250 km to 500 km, giving you four times the number of potential customers/market size.
- Strategise: Where am I now? Where do I want to be? What is the best way to analyse my plants, competitor plants and the market? What is the most profitable mix for my cement business within 500 km? What is my market share? Do I make OPC33, OPC43, OPC53, Pozzolana Cement or Sulfate Resisting Portland Cement?
- The complexity of the Indian cement industry will continue to increase and more products will be developed as the industry matures and grows. Now is the time to get it right.
Written by George Handley
Read the article online at: https://www.worldcement.com/asia-pacific-rim/15072013/revolution_in_the_profitability_of_indian_cement_plants/
You might also like
The World Cement Podcast
A podcast series for professionals in the cement industry featuring short, insightful interviews. Subscribe on your favourite podcast app to start listening today.
![]()
![]()
![]()
![]()
